Introducing: Extended Traces
Charly Poly· 11/12/2025 · 3 min read
We are thrilled to release Extended Traces, a new way to augment your Inngest Traces with database transaction information, 3rd-party requests, and more! Now available in public beta in our TypeScript SDK.
From shipping business-critical to AI workflows, we know that observability is key in building a reliable back-end. Inngest Traces is part of our strong commitment to better observability, from making them available locally in the Inngest DevServer, to adding AI Traces, and now extending them to third-party libraries and providers with the Open Telemetry standard.
Introducing Extended Traces
Developers often rely on error messages or step-level logs to debug their workflows. But what happens inside those steps—database queries, HTTP requests, or LLM API calls—remains a black box. Without visibility into these nested operations, pinpointing failures or performance bottlenecks can be time-consuming and frustrating.
Extended Traces solves this by automatically capturing OpenTelemetry spans from within your Inngest functions. Now, you can:
- Track every database query (e.g., Prisma operations)
- Monitor third-party API calls (e.g., Resend, Stripe, or custom integrations)
- Visualize nested spans for a detailed performance overview of 3rd party libraries
- Extend it if needed by providing a custom traces provider

How it works
Enabling extended traces for all outgoing HTTP requests and Prisma database queries only requires a few lines of code:
import { Inngest } from "inngest";
import { extendedTracesMiddleware } from "inngest/experimental";
import { PrismaInstrumentation } from "@prisma/instrumentation";

const extendedTraces = extendedTracesMiddleware({
  instrumentations: [new PrismaInstrumentation()],
});

export const inngest = new Inngest({
  id: "extended-traces-demo",
  name: "Extended Traces Demo",
  middleware: [extendedTraces],
});
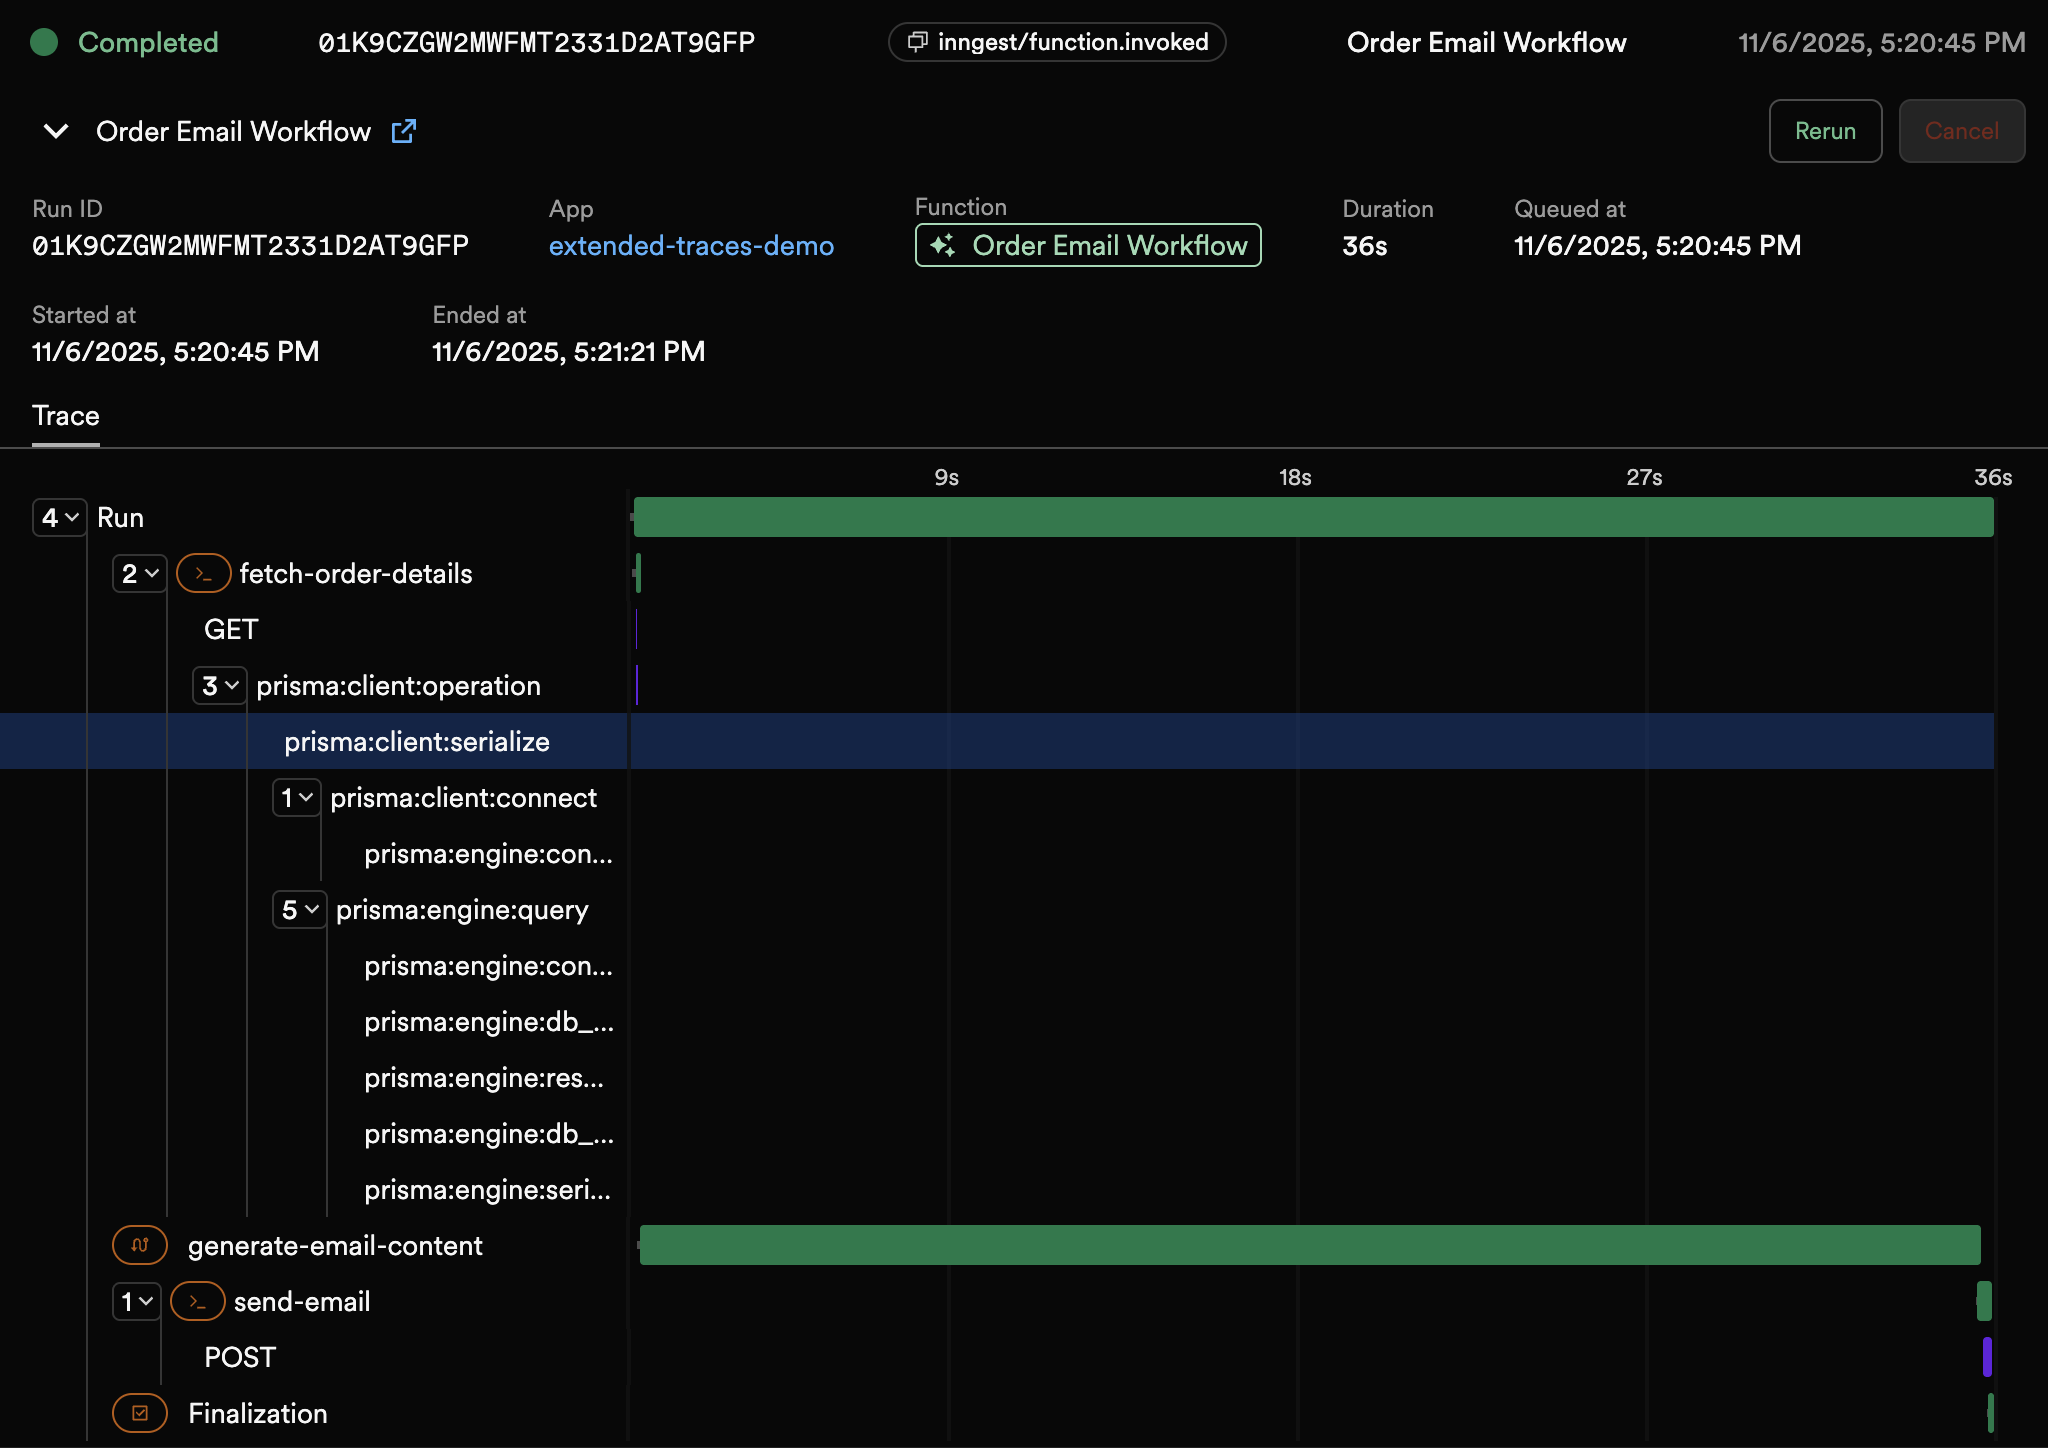
Once enabled, Extended Traces surfaces detailed spans alongside your existing workflow traces. For example, in the screenshot below, you can see:
- Prisma operations, including connection, query execution, and serialization
- Nested spans for AI/LLM calls (e.g., token usage, model details)
- A
fetchcall to an external API (Resend)
With Extended Traces, you can:
- Locate failures in third-party APIs or database queries
- Measure the performance of individual steps in great detail
- Correlate spans with your workflow steps for end-to-end visibility
What's Next?
Observability shouldn't stop at your workflow steps. With Extended Traces, you can finally see—and fix—what's happening under the hood.
Extended Traces is currently in public beta. We're actively gathering feedback to improve the feature and expand support for more libraries and use cases. Try it out and let us know what you think!