OpenTelemetry is an open-source observability framework that provides a standardized way to collect and export telemetry data, including traces, metrics, and logs. In this tutorial, you will learn how to implement OpenTelemetry tracing in your Node.js and Express application, so you can see end-to-end spans across API requests and background workflows.
1. Introduction to OpenTelemetry and Tracing
OpenTelemetry is essential when deploying Node.js applications to production, providing an end-to-end visibility of ongoing actions performed by external systems (ex, APIs, webhooks) or users.
The OpenTelemetry standard takes shape as traces and spans:
- Trace: A trace represents the lifecycle of a request as it flows through your application.
- Span: A span represents a single unit of work or operation within a trace (ex, a database query).
- Distributed Traces: The link between traces spanning across many components of your application. For example, an API endpoint triggering a background workflow.
Traces become increasingly useful in Node.js applications that combine multiple components, such as microservices or background workflows, as they help follow the lifecycle of an incoming request or user action across the whole application.
Let's now see how to set up OpenTelemetry in a Node.js user API, triggering a background workflow upon user creation (ex, sending onboarding emails).
The tutorial's source code is available on GitHub.
2. Setting Up OpenTelemetry in Node.js (Express + OTLP)
First, you need to install the necessary packages for your Node.js application and configure OpenTelemetry. If you're starting fresh, run npm init -y and set "type": "module" in package.json so the ESM imports work seamlessly.
Install the Required Packages
Run the following command to install the necessary packages:
npm install @opentelemetry/sdk-node @opentelemetry/api @opentelemetry/exporter-trace-otlp-http express inngest
We installed:
- Express to serve our application's API
- The OpenTelemetry Node.js client automatically captures Express operations.
- The OpenTelemetry OLTP exporter, which will enable us to visualize the Express traces.
- The Inngest SDK to create background workflows with embedded OpenTelemetry traces.
Initialize and configure OpenTelemetry
Create a new file named tracing.js and add the following code to initialize OpenTelemetry:
// tracing.jsimport { NodeSDK } from "@opentelemetry/sdk-node";import { OTLPTraceExporter } from "@opentelemetry/exporter-trace-otlp-http";import { InngestSpanProcessor } from "inngest/experimental";import { inngest } from "./workflow.js";// Configure OTLP endpoint for Jaeger using the HTTP exporter// Jaeger typically accepts OTLP HTTP on http://localhost:4318/v1/traces// Override via OTEL_EXPORTER_OTLP_ENDPOINT or OTEL_EXPORTER_OTLP_TRACES_ENDPOINTconst traceExporter = new OTLPTraceExporter({url:process.env.OTEL_EXPORTER_OTLP_TRACES_ENDPOINT ||process.env.OTEL_EXPORTER_OTLP_ENDPOINT ||"http://localhost:4318/v1/traces",});const sdk = new NodeSDK({traceExporter: traceExporter,// Inngest's OTel extension also captures Express and Node.js tracesspanProcessors: [new InngestSpanProcessor(inngest)],// Set service name for JaegerserviceName: "nodejs-open-telemetry-example",});sdk.start();console.log("OpenTelemetry SDK started");console.log(`Tracing endpoint: ${process.env.OTEL_EXPORTER_OTLP_TRACES_ENDPOINT ||process.env.OTEL_EXPORTER_OTLP_ENDPOINT ||"http://localhost:4318/v1/traces"}`);
3. Creating an Express User API with Tracing Enabled
Create a new file named app.js and set up a basic Express server with a route to create users:
// index.js// Import the tracing setup FIRST - must be before any other importsimport "./tracing.js";import express from "express";const app = express();const port = 3000;// Middleware to parse JSON bodiesapp.use(express.json());// User creation routeapp.post("/users", async (req, res) => {const { name, email } = req.body;console.log(`Creating user: ${name}, ${email}`);// add a HTTP request for tracing demo purposesawait fetch("https://api.restful-api.dev/objects");res.status(201).send({ message: "User created successfully" });});// Example: Create a new user// curl -X POST http://localhost:3000/users -H "Content-Type: application/json" -d '{"name": "John Doe", "email": "john.doe@example.com"}'app.listen(port, () => {console.log(`User API listening at http://localhost:${port}`);});
4. Using Inngest for Background Workflows with Traces
Let's now update our Express API to kick off a background onboarding workflow upon user creation. We'll use Inngest, which enables us to write durable workflows without having to set up a Redis storage or deal with workers and queues:
// workflow.jsimport { Inngest } from "inngest";import { extendedTracesMiddleware } from "inngest/experimental";export const inngest = new Inngest({id: "nodejs-open-telemetry-example",name: "NodeJS Open Telemetry Example",middleware: [extendedTracesMiddleware()],});export const userOnboarding = inngest.createFunction({id: "user-onboarding",},{ event: "user.onboarding" },async ({ event, step }) => {console.log(`User onboarding: ${event.data.name}, ${event.data.email}`);await step.run("create-user", async () => {console.log(`Creating user: ${event.data.name}, ${event.data.email}`);// add a HTTP request for tracing demo purposesawait fetch("https://api.restful-api.dev/objects");return {name: event.data.name,email: event.data.email,};});await step.run("send-welcome-email", async () => {console.log(`Sending welcome email to: ${event.data.name}, ${event.data.email}`);return {name: event.data.name,email: event.data.email,};});});
Inngest's Extended Traces middleware helps automatically capture workflow steps, database queries, and HTTP requests as OpenTelemetry traces.
Let's now update our Express API to trigger the workflow from the POST /api/users endpoint:
// index.js// ...import { serve } from "inngest/express";import { inngest, userOnboarding } from "./workflow.js";const app = express();const port = 3000;// Middleware to parse JSON bodiesapp.use(express.json());app.use(// Expose the middleware on our recommended path at `/api/inngest`."/api/inngest",serve({ client: inngest, functions: [userOnboarding] }));// User creation routeapp.post("/users", async (req, res) => {const { name, email } = req.body;console.log(`Creating user: ${name}, ${email}`);// add a HTTP request for tracing demo purposesawait fetch("https://api.restful-api.dev/objects");// trigger the user onboarding workflowawait inngest.send({name: "user.onboarding",data: {name: name,email: email,},});res.status(201).send({ message: "User created successfully" });});// ...
We are now ready to start our API, send a test API request, and inspect the OpenTelemetry traces!
5. Visualizing OpenTelemetry Spans in Jaeger (OTLP)
To visualize the spans generated by Express and Inngest, you can use a visualization UI like Jaeger.
Follow these steps to set up Jaeger:
-
Install Jaeger:
Jaeger natively supports OTLP to receive trace data. You can run Jaeger in a Docker container with the UI accessible on port 16686, and OTLP enabled on ports 4317 and 4318:
docker run --rm \-e COLLECTOR_ZIPKIN_HOST_PORT**=**:9411 \-p 16686:16686 \-p 4317:4317 \-p 4318:4318 \-p 9411:9411 \jaegertracing/all-in-one:latest -
Start the API and the Inngest DevServer:
# start the Express APInpm start# start Inngest DevServer to process background workflowsinngest dev -u http://localhost:3000/api/inngest --no-discovery -
Access Jaeger UI:
- Once Jaeger is running, you can access the Jaeger UI by navigating to
http://localhost:16686in your web browser.
- Once Jaeger is running, you can access the Jaeger UI by navigating to
-
Send a test request to the application:
curl -X POST http://localhost:3000/users -H "Content-Type: application/json" -d '{"name": "John Doe", "email": "john.doe@example.com"}' -
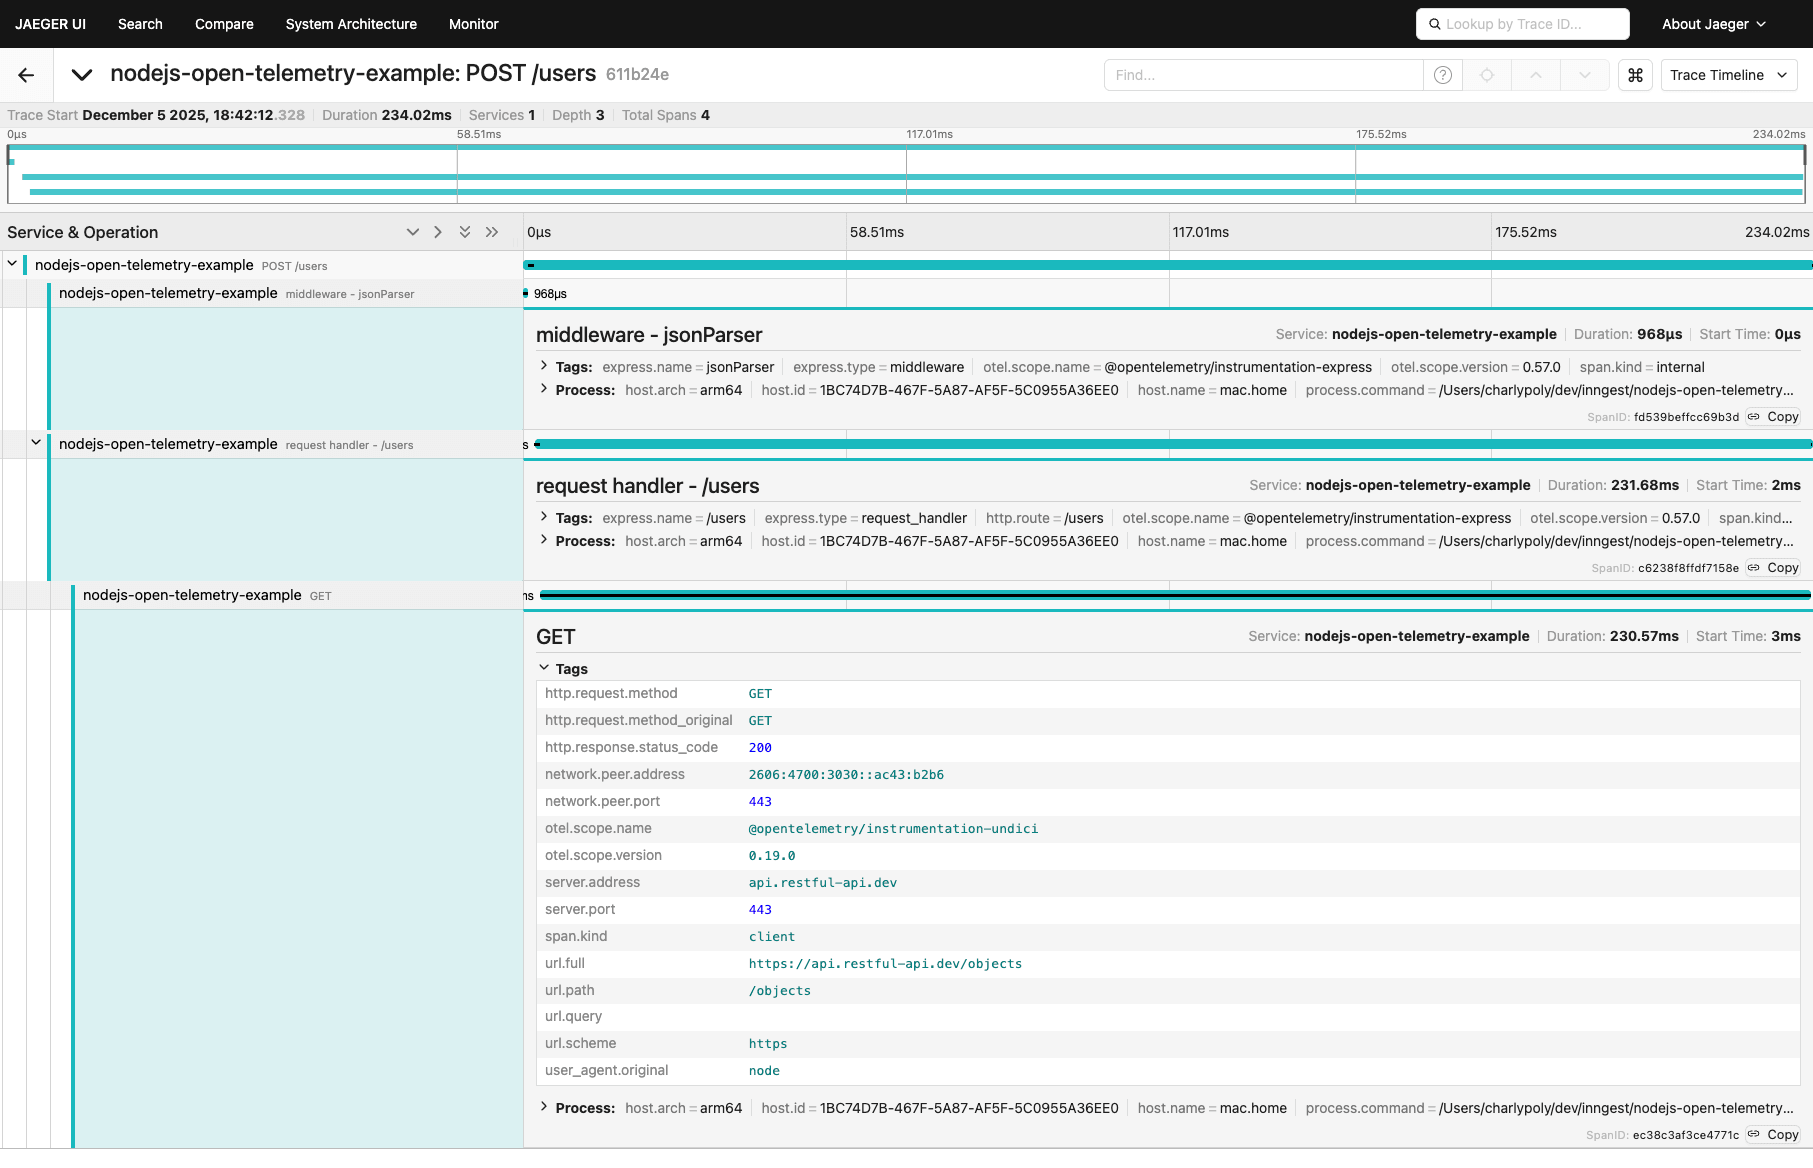
View Spans:
In the Jaeger UI, you can view the spans generated by your Express application. By selecting the “nodejs-open-telemetry-example” service and click on “Find Traces”, a list of traces will display. This will help you understand the flow of requests and identify any performance bottlenecks across Express requests and workflow steps.
-
Bonus: access the live Inngest Traces from the Inngest DevServer
Open a new tab at
http://127.0.0.1:8288/runsand inspect the Inngest Traces, which comes as a complementary essential tool for local development: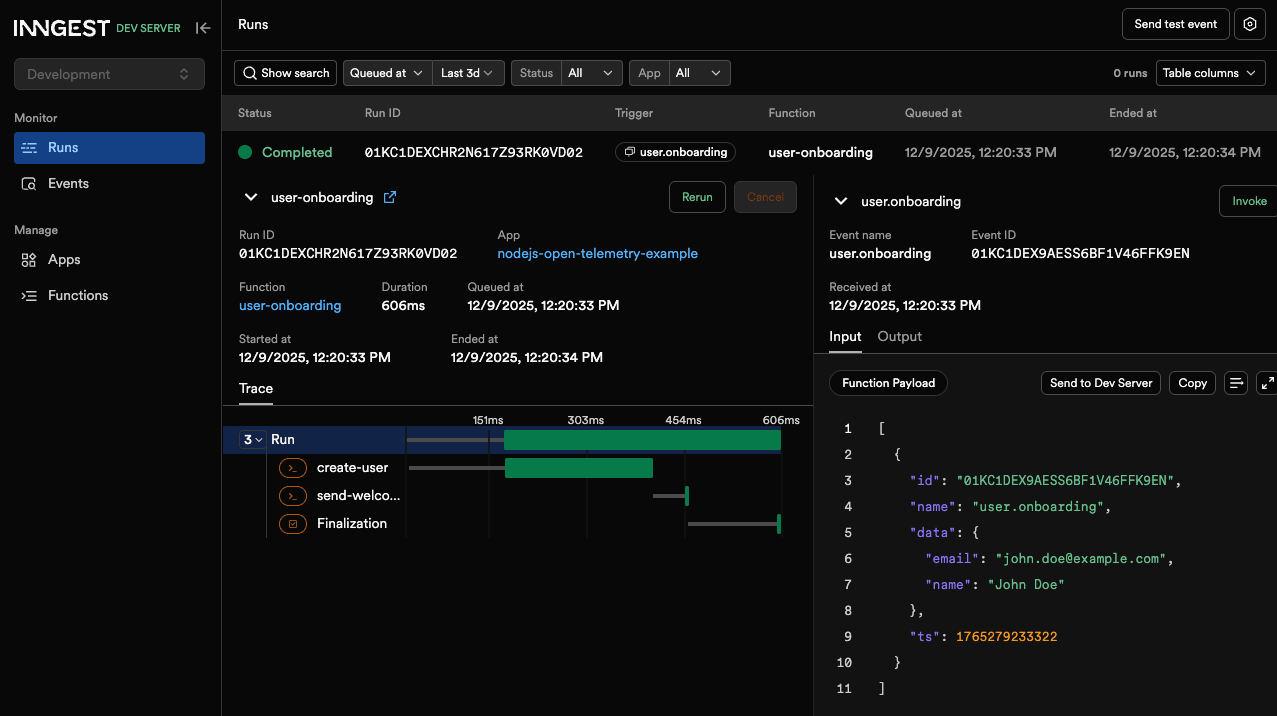
You now have a robust observability template for any Node.js Express + background workflow application. With OpenTelemetry configured, your Node.js application won't have any secrets, enabling you to be notified of any errors and quickly narrow down the root causes of bugs.
6. Bonus: Creating Custom Spans in Node.js
The automatic spans collection for Express and Inngest workflows comes in handy, but can miss some other spots from your applications.
The OpenTelemetry Node.js client enables you to create custom spans by using the trace API. Here's an example of how to create custom spans in your Express route:
// index.js//...import { trace } from "@opentelemetry/api";//...// User creation routeapp.post("/users", async (req, res) => {const { name, email } = req.body;console.log(`Creating user: ${name}, ${email}`);const tracer = trace.getTracer("user-api");const span = tracer.startSpan("create-user", {attributes: { "user.name": name, "user.email": email },});try {await fetch("https://api.restful-api.dev/objects");await inngest.send({name: "user.onboarding",data: {name: name,email: email,},});span.end();res.status(201).send({ message: "User created successfully" });} catch (error) {span.recordException(error);span.end();res.status(500).send({ message: "Error creating user" });}});//...
The same pattern can be applied to Inngest Workflows using Extended Traces:
// workflow.js// ...export const userOnboarding = inngest.createFunction({ id: "user-onboarding" },{ event: "user.onboarding" },async ({ event, step, tracer }) => {const { name, email } = event.data;await step.run("create-user", async () => {tracer.startActiveSpan("create-user-request", async (span) => {span.setAttributes({ name, email });await fetch("https://api.restful-api.dev/objects");span.end();});});await step.run("send-welcome-email", async () => {// ...});});
Conclusion
Implementing OpenTelemetry tracing in your Node.js application can significantly enhance your observability, helping you to debug and optimize your systems more effectively.
By following the steps outlined in this article, you'll be able to capture detailed traces, identify bottlenecks, and improve overall performance. For those managing complex workflows, integrating tools like Inngest can further enhance your observability and streamline your processes.
Start tracing today and take the first step towards more efficient and maintainable applications.
FAQ: OpenTelemetry Tracing in Node.js
How do I export OpenTelemetry traces from Node.js to Jaeger?
Use the OTLP HTTP exporter pointed at http://localhost:4318/v1/traces (or set OTEL_EXPORTER_OTLP_TRACES_ENDPOINT), then start Jaeger with OTLP enabled as shown above.
Does Express support automatic OpenTelemetry instrumentation?
Yes, when you use @opentelemetry/sdk-node with the default auto-instrumentations, Express handlers and middleware are traced without manual span creation.
How do I trace background jobs and workflows in Node.js?
Use Inngest with extendedTracesMiddleware() to capture each workflow step as spans, and send events from your API (/users) to user.onboarding so both the request and workflow appear in a single trace.