In recent weeks, we've incurred several incidents, from minor to critical, and one resulting in data loss. We understand the significant impact that these issues have on our customers and the businesses and products that they build. We greatly apologize for these issues and the impact overall.
This post documents a report of several recent incidents including what happened, what impacted them, and what we did to fix them. Additionally, this covers some changes that we've made in our team to improve incident response and transparency overall.
Event API partial downtime and stale run history
On October 16th, our Event API began restarting inconsistently. The Event API is responsible for accepting events into the system.
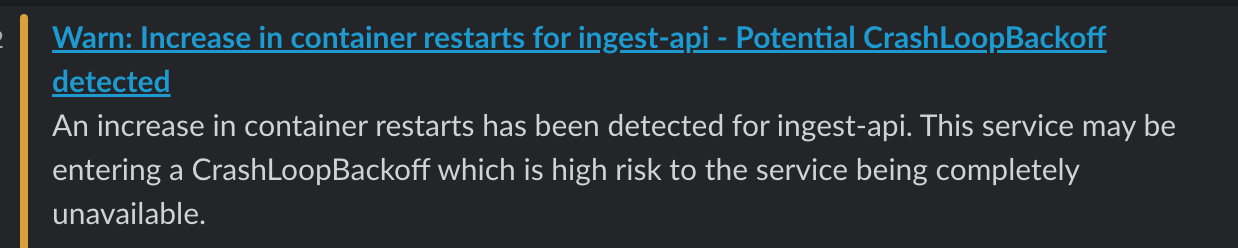
We received alerts stating the Event API latency is high from multiple regions in addition to a warning for crashloops for these containers. We started investigating the issues immediately.

Quickly, our engineers narrowed the cause to an issue with one of our Kafka cluster's disks filling up. We run multiple Kafka clusters internally for data ingestion for different types of data. This Kafka cluster handles span ingestion for tracing for runs which is transported to ClickHouse. This cluster does not handle the ingestion of event data itself.
The Event API is a producer of root spans for traces and the build up of the data on the producer side eventually exhausted the file descriptors for the Event API containers. This started to cause some API requests to time out.
As the timeouts happen, and file descriptors are released, more batches of queued requests are allowed, and they will fill up the file descriptors next, essentially creating an GCRA-like rate limit behavior.
Additionally, as this Kafka cluster handles span and run traces data ingestion, this also affected some of our execution workers that also publish spans for run traces. This caused delays and, in some cases, dropped spans from execution workers resulting in stale or incorrect trace data.
In the ongoing effort to remediate the disk issue, we ran into a chicken and egg problem with operating Kafka in containers. The containers couldn't start up due to a full disks and we can't access the disks without having a running container that we can enter. The persistent volume claims were declared with a 1:1 mapping to these containers.
To mitigate the impact of the incident, we decided to prioritize work on getting the Event API up and successfully accepting events first, then focus on the span ingestion for observability later. The Event API must accept events to trigger functions to be scheduled, resume waitForEvent's, handle cancellation and handle flow control like singletons. We understood that the loss of observability/trace data would be a poor experience, but execution is a higher system priority.
The immediate hot fix to the issue at hand was to clear out enough space for the Kafka containers to boot up and start the clean up. We ended up having to delete a handful of disks to clear the way for the containers to boot then we started the recovery of the cluster immediately after.
With the cluster now operating, the Event API recovered with the execution worker containers that published to the affected Kafka cluster.
Additional areas of mitigation included:
- Added additional monitoring and alerting on Event API uptime and this Kafka cluster to notify us about potential issues faster.
- Implemented stricter retention bytes configuration on top of existing duration-based retention configuration.
We have other research-based follow-ups that the team will work on in the coming weeks to prevent this class of failure again.
Delayed function scheduling/execution and Dashboard outage
Over the last two months, we've experienced some isolated system wide delays caused by our application database performance degradation. Our application database is run on Postgres and stores metadata and configuration of customer applications, functions and other data. Additional data for events, run history, traces are stored in ClickHouse and data for active function runs are stored in other low latency databases.
Although we've shipped several improvements to mitigate performance issues in our application database, on October 20th, at around 16:00 UTC, it hit a new limit of scale which put a new level of load on our database. This immediately caused the Inngest dashboard to be unresponsive and severe system-wide delays on function scheduling and execution.
For context, Inngest primarily runs on bare metal servers, but some legacy services are still hosted in AWS. This database was one of those remaining services, hosted on AWS RDS. This had mostly served us well with heavy use of a pull-through cache to ensure that we do not saturate the database with load. This setup has provided a stable state for the last 2-3 years.
More recently, we've observed a steady decline in our IOPS balance on this RDS database, and our operations have started to be throttled when this balance goes to zero.
Over the previous couple of weeks, the team had already worked to improve the overall performance of the database using query analyzers and better indices, but the work didn't result in much improvement in terms of IOPS consumption. Additionally, due to limited information provided in RDS, it was unfortunately not simple to correlate our efforts with changes in performance of the database.
October 20th was also the day of the us-east-1 outage for AWS, which shouldn't have affected our database running in us-east-2, but given the overall degraded state of AWS systems that day, we ran into some issues with trying to mitigate the database issues.
In addition, as we had exhausted our IOPS, our efforts to quickly increase our IOPS on the cluster did not take effect as there is an unknown “cool down period” before these upgrades can be applied. This period is opaque and from what we could understand, would be at least 6 hours. Vertical scaling would have resulted in an unknown amount of downtime, even with multi-az RDS, so decided to avoid that. At this point, the system was operating, but under heavy delays.
Over the previous weeks we had considered migrations away from RDS, but this event pushed the team to accelerate that decision. Several hours into the incident, the team started exploring a potential migration to PlanetScale in parallel to working on RDS.
With some research and some experimentation, the team executed a migration to PlanetScale over the next few hours completing the cutover about 05:30 UTC on October 21st. There were some hiccups post-migration including issues with our database migration tool, which set an indefinite advisory lock when connecting via PgBouncer. We chose to temporarily shift connections for our API servers which handle migrations to connect directly to the database and not via PgBouncer.
The system remained stable until load started to increase hours later, around 8:40 UTC during normal daily usage increases. CPU utilization on our new database cluster was stuck at 100% which again caused slowness across our dashboard and function scheduling and execution.
We shipped several mitigations over the next few hours including query optimizations, rebuilding indexes after the migration, refactoring out some expensive queries, and also moving db migrations to a sidecar pod on startup. The last task enabled us to switch our connections for some services to connect back through PlanetScale's included PgBouncer which reduced connections to about 50% of what they were at peak. This, combined with other efforts enabled us to reduce CPU usage down to 30% in a short period of time. With CPU reduced, database performance now was at levels never previously reached on our RDS database.
Additionally, with our migration to our new PlanetScale cluster, our original IOPS issue is no longer a class of issue that we will encounter. The behavior of this system is much different from RDS and our new cluster has 10x the IOPS headroom than we need at peak volume.
We plan to expand in more detail about this migration on another blog post in the future.
Execution delays caused by Kafka throughput reductions
Unfortunately, a day later, on October 22nd, additional function execution delays were also caused by Kafka. This again, was our Kafka cluster responsible for traces and observability that had issues days earlier. The issues here delayed our execution workers that published trace data to Kafka.
While our monitoring shows that Kafka is healthy and operational, we noticed that there were OutOfOrderSequenceError emitted in the broker logs. If you don't know what that error means, just understand that Kafka requires a linear sequence of logs, and brokers will reject publish requests if the number doesn't match. There are different cases this could happen, but the most common one is after a broker recovers.
The good news is that this error won't result in data loss generally, and the producer will retry with a successful attempt later. But if there are multiple producers having to retry publishing due to rejections, this will slow down the publish rate of data.
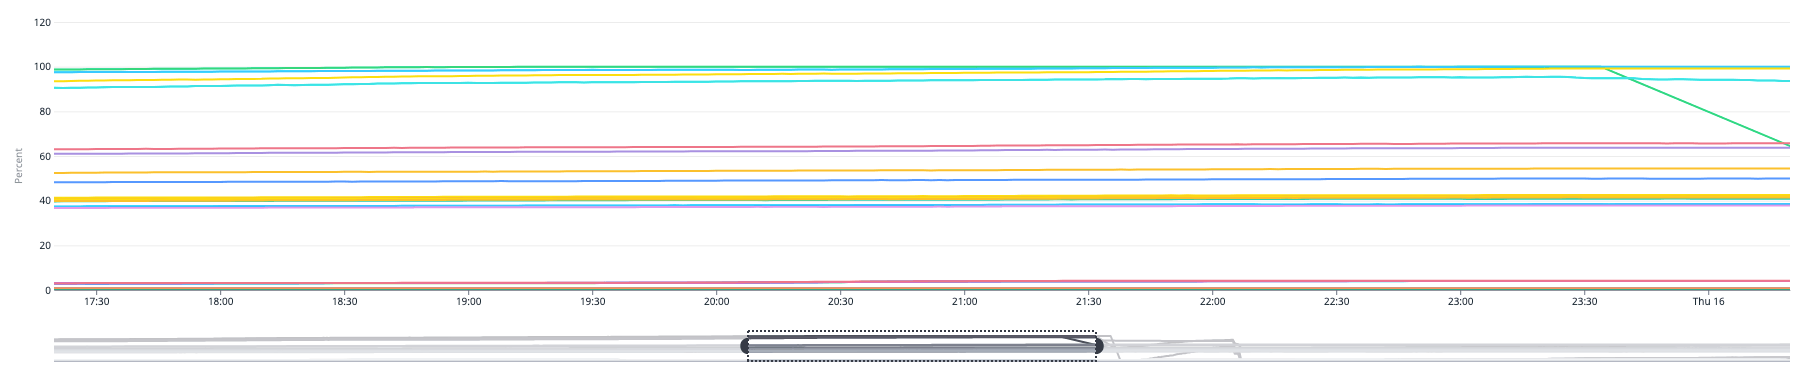
And in our case, it surfaced as a performance and throughput degrade across our execution fleet, where the throughput declines significantly from previous levels.
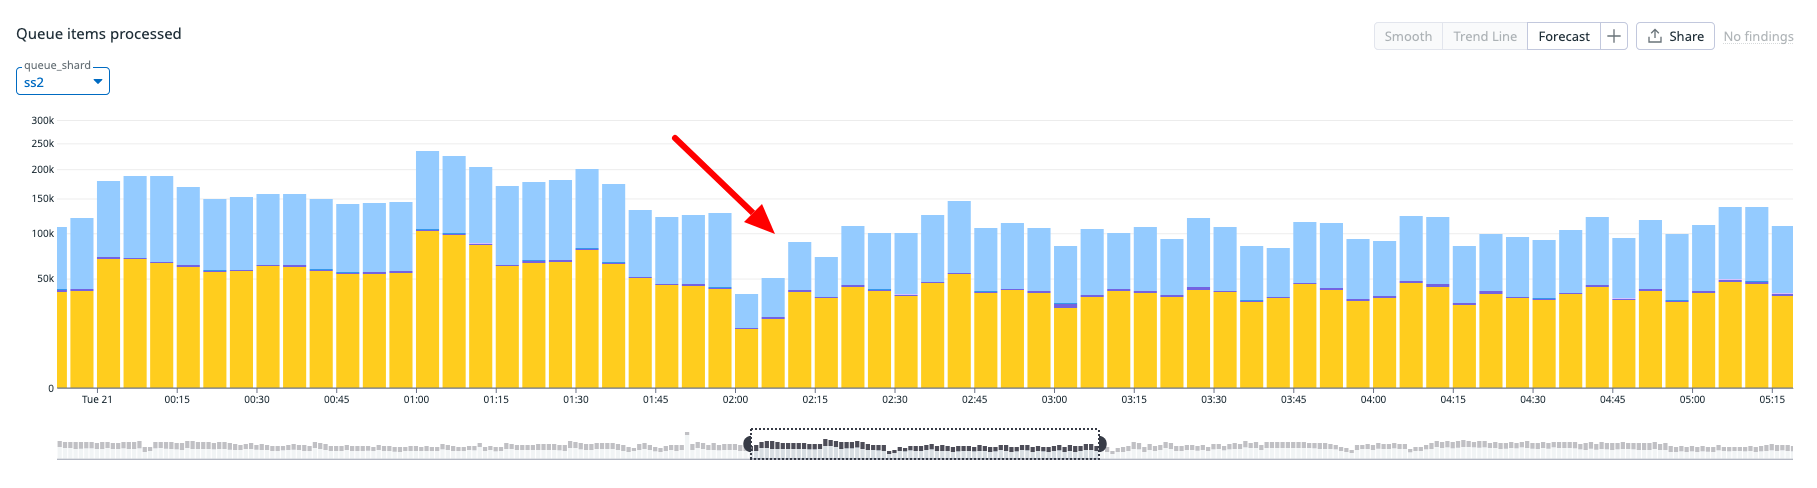
Metrics showing throughput drop in one of our shards
Fixing this issue requires a couple of steps
- Find the brokers that are affected
- Find the producers that are publishing out of order messages
- Reboot the problematic producers
- Observe error rates, and repeat from #1
The throughput of the cluster gets better as the number of OutOfOrderSequenceError reduces, and we were able to confirm throughput of the system recovered with the Kafka brokers.
As the cluster throughput increased, function execution improved.
In an additional effort to mitigate this issue, we took this opportunity to refactor our execution workers to optimize how trace data is batched and sent to Kafka. This, combined with a healthy Kafka cluster, resulted in higher performance across the board, leaving the system slightly faster than before the incident.
Dashboard loading issues caused by high ClickHouse load
Throughout the week, our entire system was seeing greater load across the board, including our APIs. Between October 22nd and 23rd, our ClickHouse database, which stores runs, traces, events, metrics and insights saw higher load than normal, resulting in a significant performance issue. As this database stores all of this observability data that powers the Inngest dashboard, our dashboard started experiencing issues include slow loading times, timeouts, and dropped connections.
While our system was experiencing higher load, the optimizations shipped the previous day in our execution workers also put even more load on our ClickHouse cluster as writes were higher than ever before. The cluster became CPU bound performance was heavily degraded.
Throughout the incident response, we scaled up cluster resources and ran analysis on slow queries and API request patterns. With this data, we decided to isolate reads and writes into dedicated clusters, changing our setup to a ClickHouse warehouse. With both increased writes and reads, this setup should ensure better performance as both loads are isolated to their own compute resources.
After this change rolled out, we still noticed inconsistent metrics, so we spun up a new dedicated cluster that serves API requests from our Inngest dashboard only, ensuring isolated resources from other public APIs and parts of our system. This setup led to more performant and consistent load times in our dashboard.
We are continuing with additional follow-up mitigations digging into our elevated Clickhouse usage for new tables including query optimization and revisiting how data is partitioned for faster lookups.
Stale run history data
In parallel during the last couple of weeks, we saw increased reports around stale or inaccurate run history data. Due to the asynchronous nature of how data moves between our execution workers to Kafka to ClickHouse, some delays are expected, but some bugs in how runs status are displayed in our dashboard had appeared.
For some time, we had been developing a new run traces system internally for Inngest to lay the groundwork for upcoming features, and with the increased reports, we decided to move the feature from closed beta to a full rollout ahead of schedule. While there were several improvements, there were some unanticipated bugs with this rollout.
Most of these bugs were related to the trace data, not the underlying function execution, which meant that what users saw in, like a run stuck in “Queued” or “Running” were not the accurate reflection of the state of their function run. While this meant that function execution wasn't affected, it created more confusion and stress for our users. With these bugs happening in parallel to some of the incidents above, it exacerbated the issues that our users faced.
To address the bug reports, we paused all feature development and dedicated a team of engineers to reproducing and fixing these issues as well as landing improvements in this new traces system.
Improving incident responses
After other incidents in recent months, our community and user base have rightly provided feedback and asked for greater transparency for incidents. We have made several changes and commitments to our incident response protocol:
- We've adjusted our response processes to ensure that we post public incidents to our status page earlier and more consistently. We invite any user who wants more realtime information, to subscribe to updates from our status page here.
- We've changed our incident response workflows in our team to better establish consistent practices, clear incident leads, consistent internal and external updates, as well as more rigor in post-mortem exercises. We've streamlined a lot of how we're doing this overall.
- As we've grown our team by 2x in 2025, we plan to hold new training for new engineers on incident responses to improve our coverage and speed when responding to issues.
- We plan to hold more incident dry runs and our first “game days” later this quarter to test our responses, runbooks, and similar.
In closing
This has been a difficult string of events over the recent weeks in terms of incidents for our system. We apologize for all of the stress, business impact, and challenges that these issues have incurred on our customers and their own customers. As a developer platform, we have to and will do better and we will commit to more transparency about these type of incidents in the future.